We just published a new paper lead-authored by Lennart de Groot at Utrecht University who just recently got his PhD “Cum Laude” (quite a distinction).
The paper is online here and I’ve tried to summarise it below.
The Earth’s magnetic field as seen at Earth’s surface is about 90% explained by a “dipole” – a single north pole opposite a single south pole – the same as a bar magnet. The dipole is not stationary but moves around and fluctuates in intensity over time. Occasionally it collapses altogether and grows back with the opposite polarity – this is called a geomagnetic reversal. The last reversal happened 780,000 years ago but there have been many more recent collapses (“geomagnetic excursions”) that haven’t resulted in reversals.
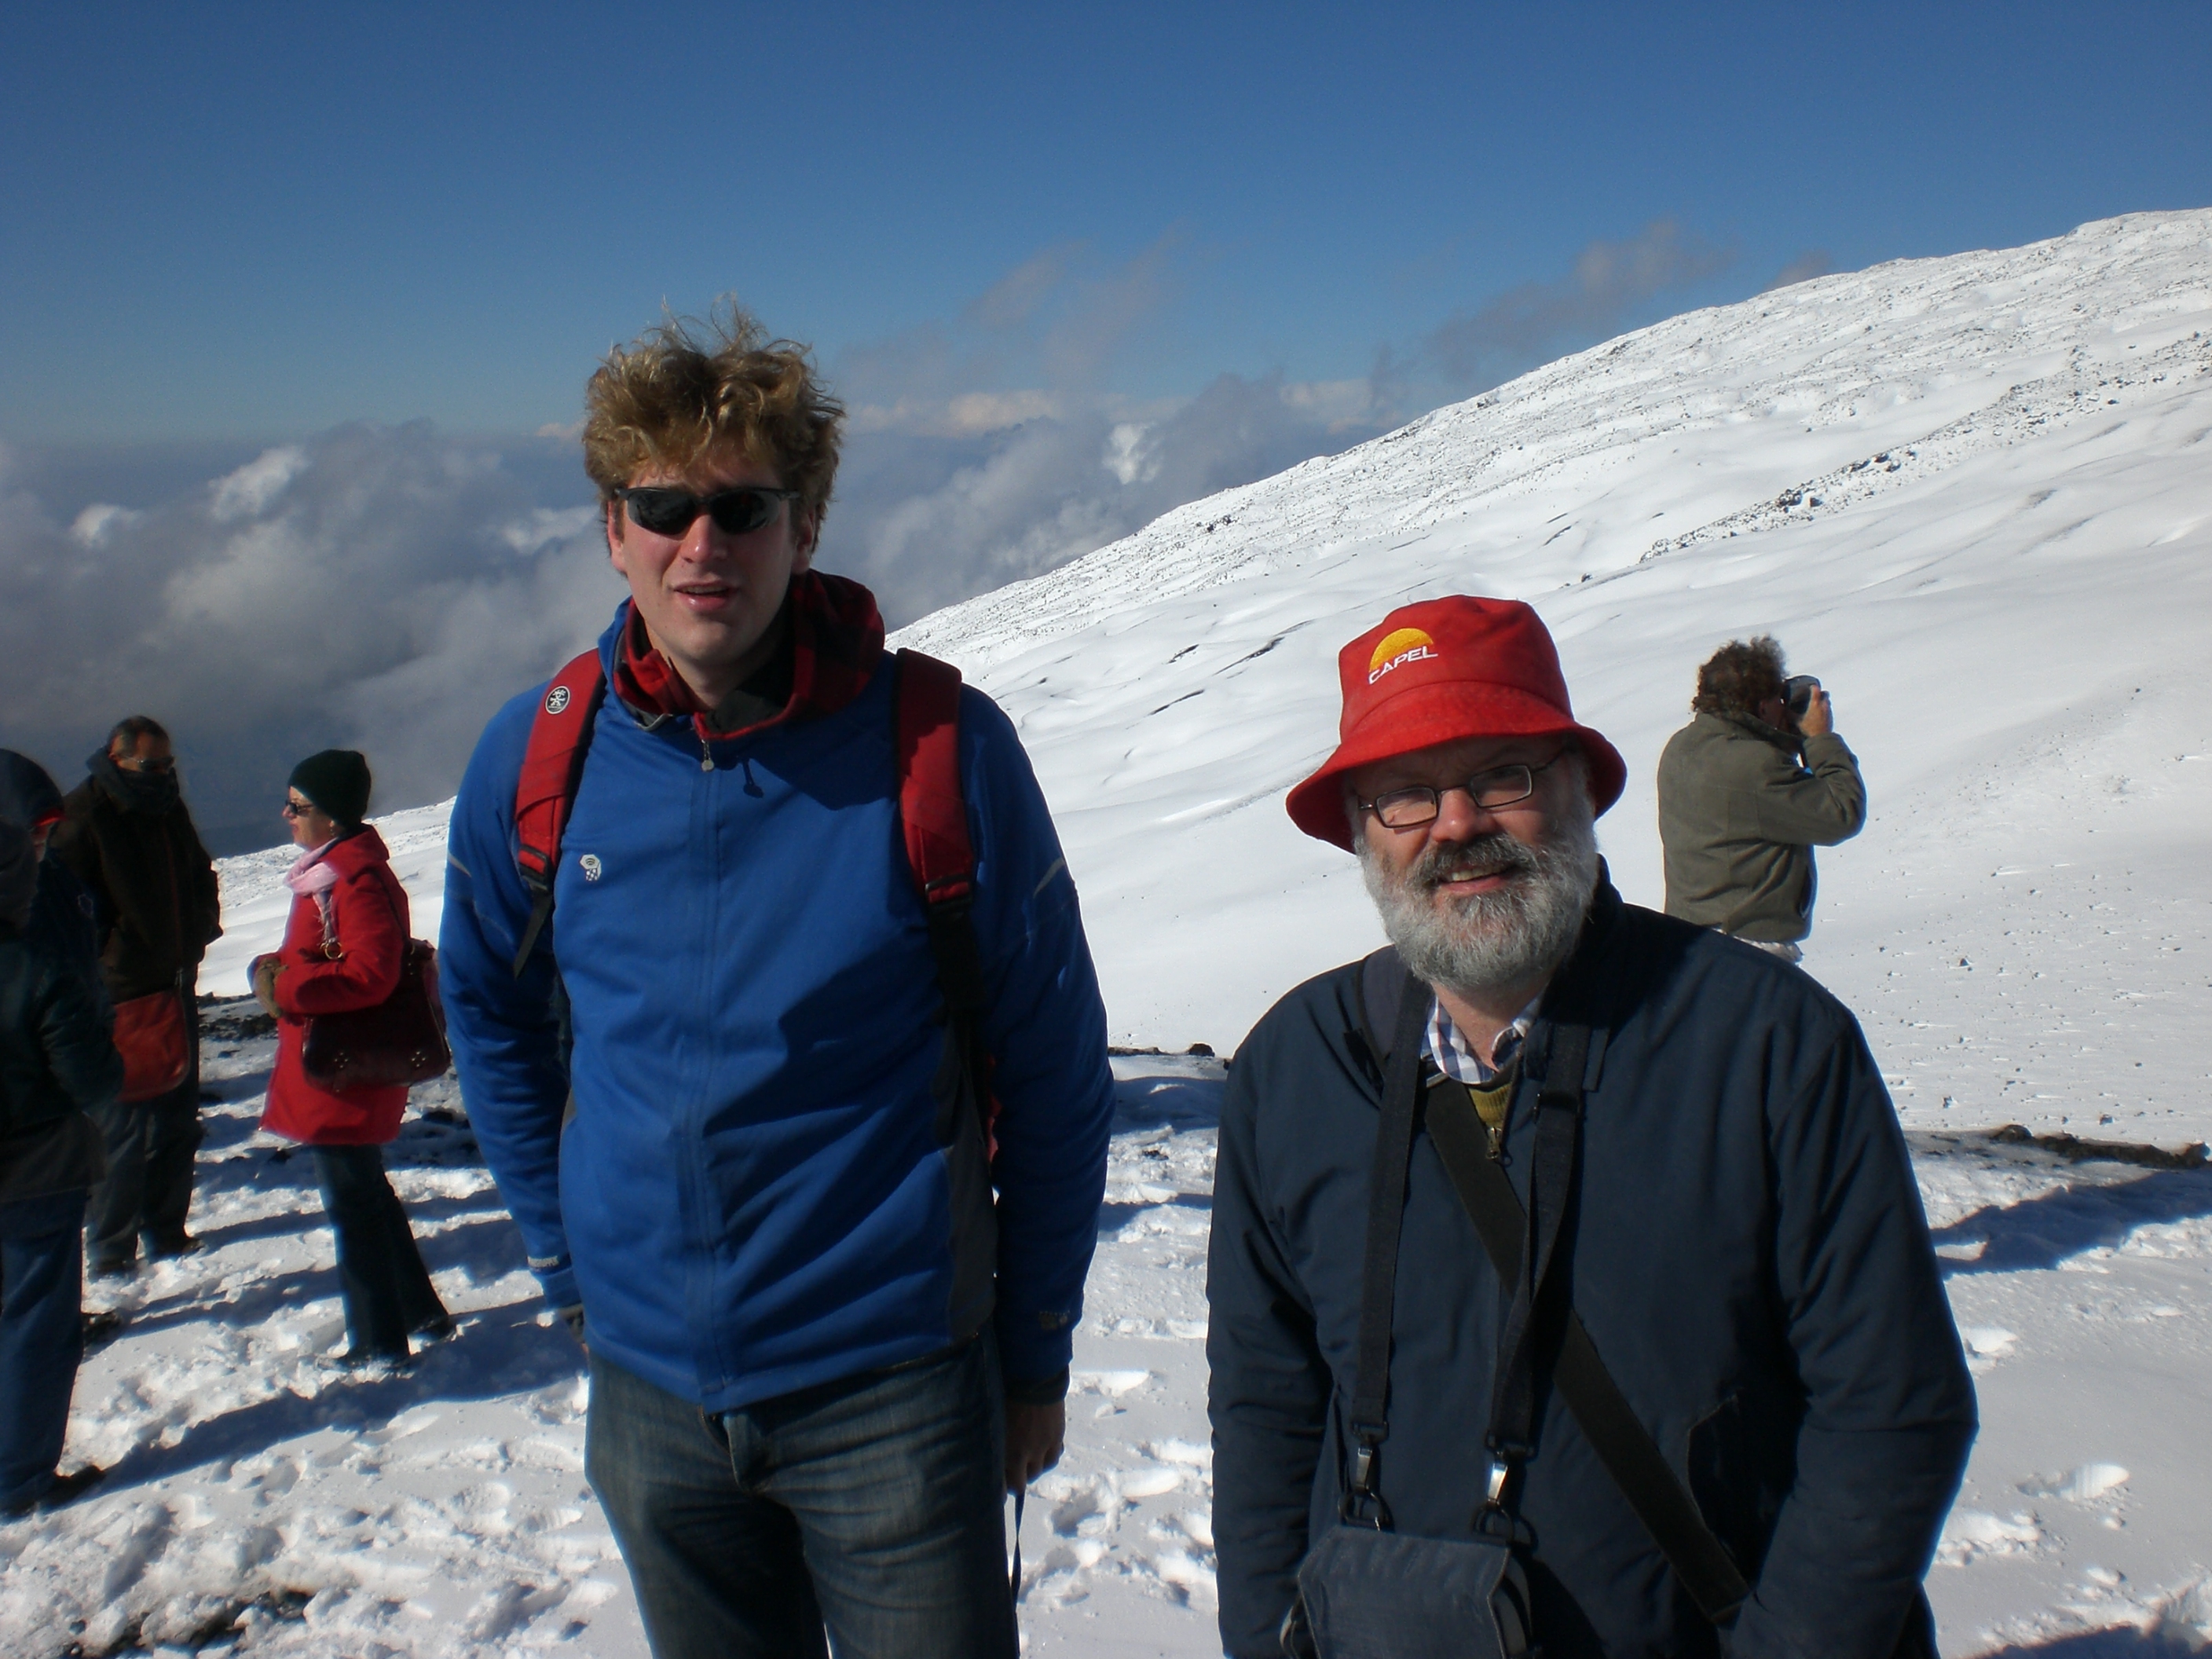
Two of the authors – Lennart and Mark on the top of Mt Etna in 2008.
The dipole has been weakening steadily (nearly 10%) since the first measurements began in 1840 AD causing some to speculate that we might be heading for a new collapse which would be bad news as magnetic storms might then become more severe. To understand this recent decline, we need to put it in context of magnetic field behaviour before 1840 and for this we have to turn to “accidental” records. The best of these are preserved in baked archaeological materials (e.g. pottery and kiln linings) but these are restricted to locations where complex civilizations existed and this leaves large areas of the globe undocumented.
Records are also preserved in volcanic rocks that have cooled from magma but these are generally much noisier than the archaeological ones because the lavas have less ideal magnetic properties than do pottery. Our study has managed to use a combination of new and old methods to produce a new high quality record from Hawaiian lavas informing us about the behaviour of the field in the sparsely populated Pacific region from around 500 AD to the present.
Combining this new record with other high quality records from archaeological materials recovered from W Europe, Japan, SW USA produces an interesting picture (see figure). As already thought, the recent decline appears to be a continuation of a declining trend going on at least 1,000 year. However, as well as this decline there are also periods of sharply increased intensity in 3 of the records (Hawaii, W Europe, SW USA) but crucially these are at different times in different places (and there is no such peak in Japan). These fluctuations, though large, can’t be explained by the dominant dipole part of the magnetic field as then you would see them everywhere. They must rather be due to the non-dipole field becoming regionally very important in a way that we have not seen since we have been making deliberate records.
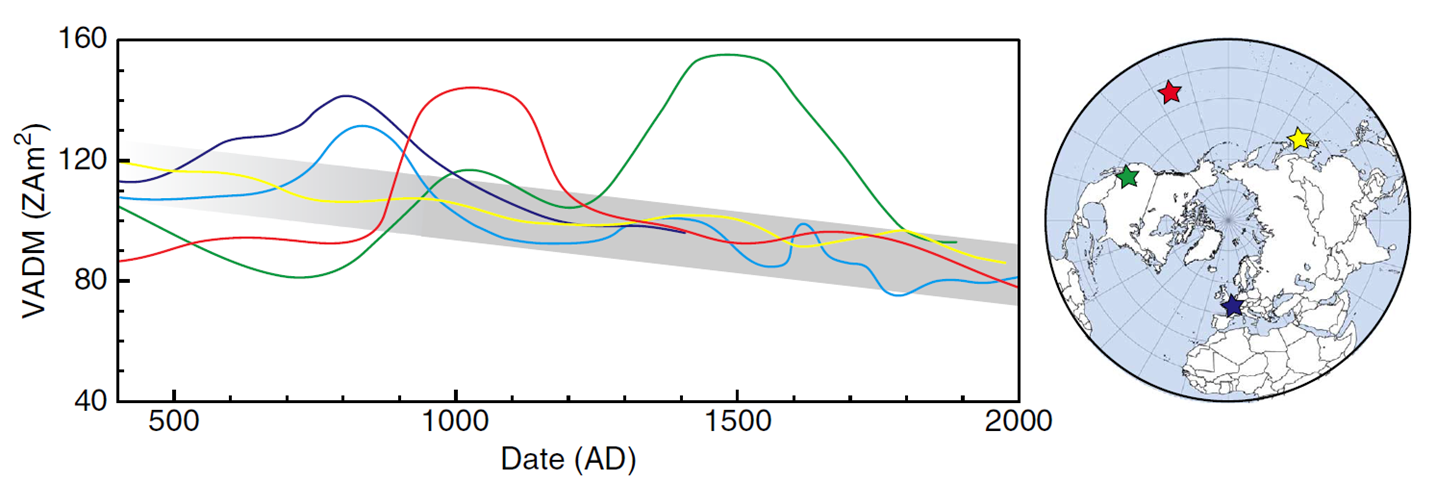
Records of the estimated strengh of the main “axial dipole” component of the magnetic field from different locations
The magnetic field is generated by the flow of electrically conducting liquid in the Earth’s outer core and all of these changes reflect the chaotic nature of this flow. In addition to producing records such as these, the challenge lies in producing believable models of core flow to explain the observational data. This might eventually be useful to help predict future magnetic field behaviour.
Leave a Reply