 In August/ September last year I was privileged to be invited to visit a French archaeological site in the midi Pyrenees in the company of Professor Philippe Lanos, director of archaeomagnetism research at the University of Rennes 1. The archaeological site was a Roman age staging post where travellers could rest their horses and enjoy a bath. As the bath area was both hot and generally made from fired material (like tiles) we heavily sampled the bath area.
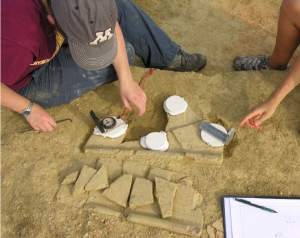
- Valerie and I taking samples. On the left I am using a magnetic compass to measure the orientation of the sample with respect to magnetic North. On the right, Valerie is using a sun compass to measure the location with respect to the sun. We also recorded the exact time and date of measurement.

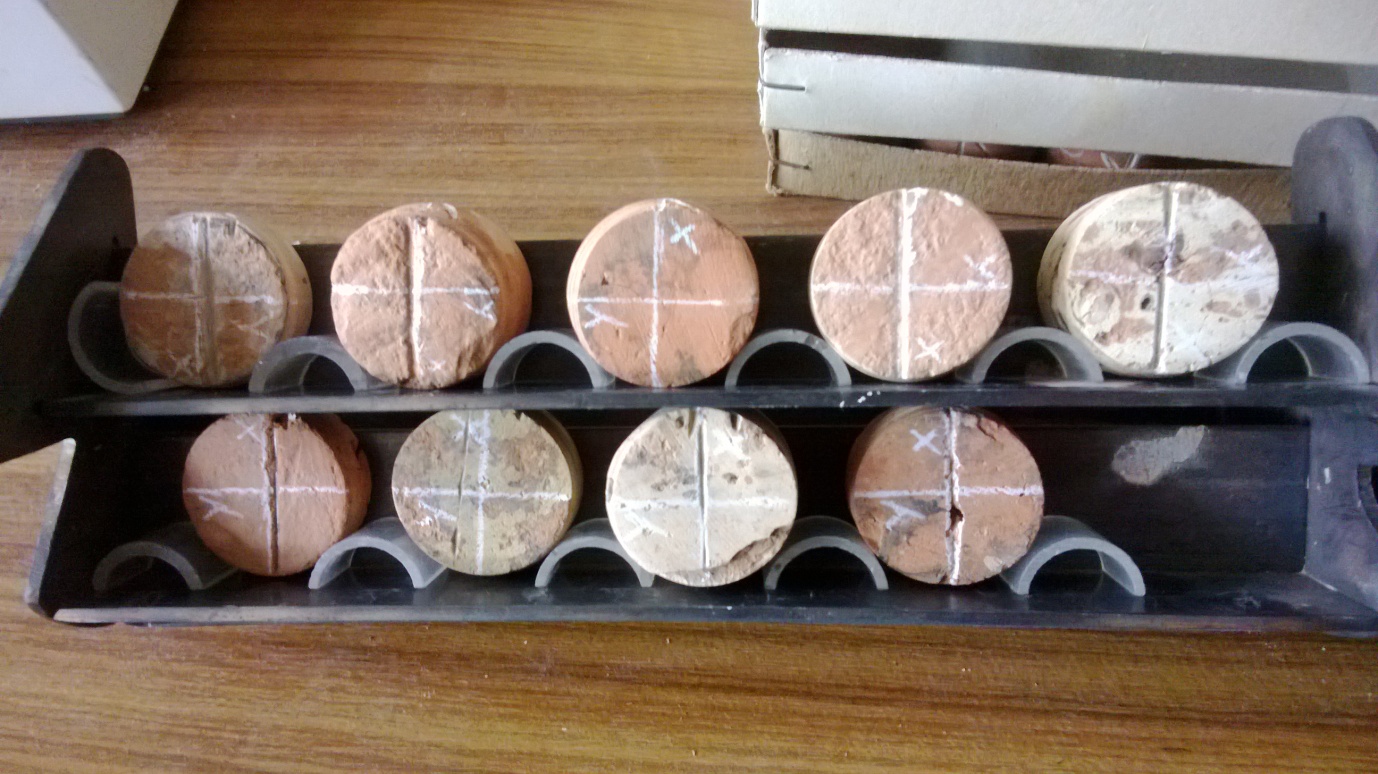
We speculated that the tiles supporting the floor of the bath (the hypocaust) may have had two magnetic components – one from their original firing when they were created as tiles and a second lower temperature component from their proximity to the fire (the praefurnium or furnace room) that was heating the bath area. We discussed whether there might be a temperature gradient with distance from the praefurnium. Hopefully the later lab experiments will help answer these questions
With the overall general aim of providing the archaeologists with potential dates depending on the magnetic signature recorded by the samples, over 200 individual samples were taken. (For more information of archaeomagnetic dating see: http://www.english-heritage.org.uk/publications/archaeomagnetic-dating-guidelines)
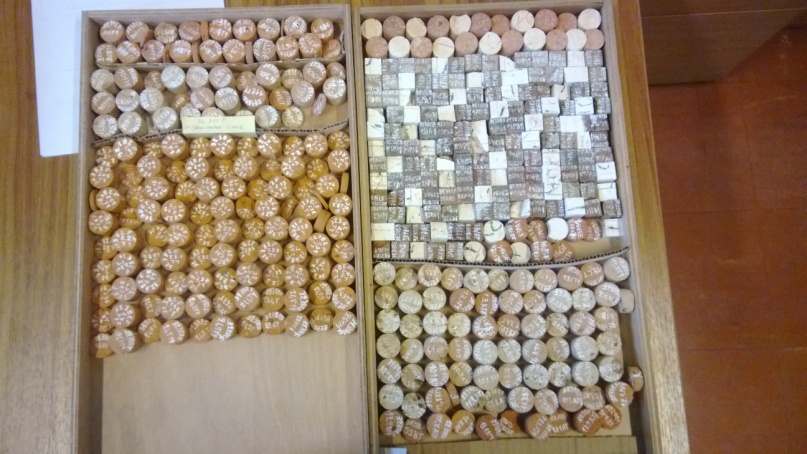
All my samples! They are a mixture of cores and cubes depending on the strength of the sample material
So when I returned to France in April of this year to begin the measuring I was faced with a lot of samples to measure. I had 6 weeks in which to do it but initially I wasn’t sure it would be enough time!
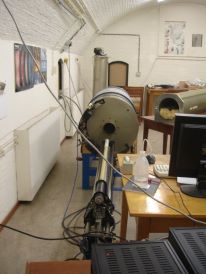
In the first 2 weeks of my trip to the Rennes 1 geomagnetism laboratory, I was able to carry out two experiments. The first was a palaeointensity experiment on 45 cores which involved repeated heating steps to increasing temperature.
In addition to the palaeointensity experiment, I also conducted a demagnetisation experiment to see if we could find evidence of two heating components in the samples from the hypocaust. When the demagnetisation experiment was completed, I carried out an anisotropy experiment to check that the samples weren’t significantly anisotropic as this can affect their ability to record magnetisation.
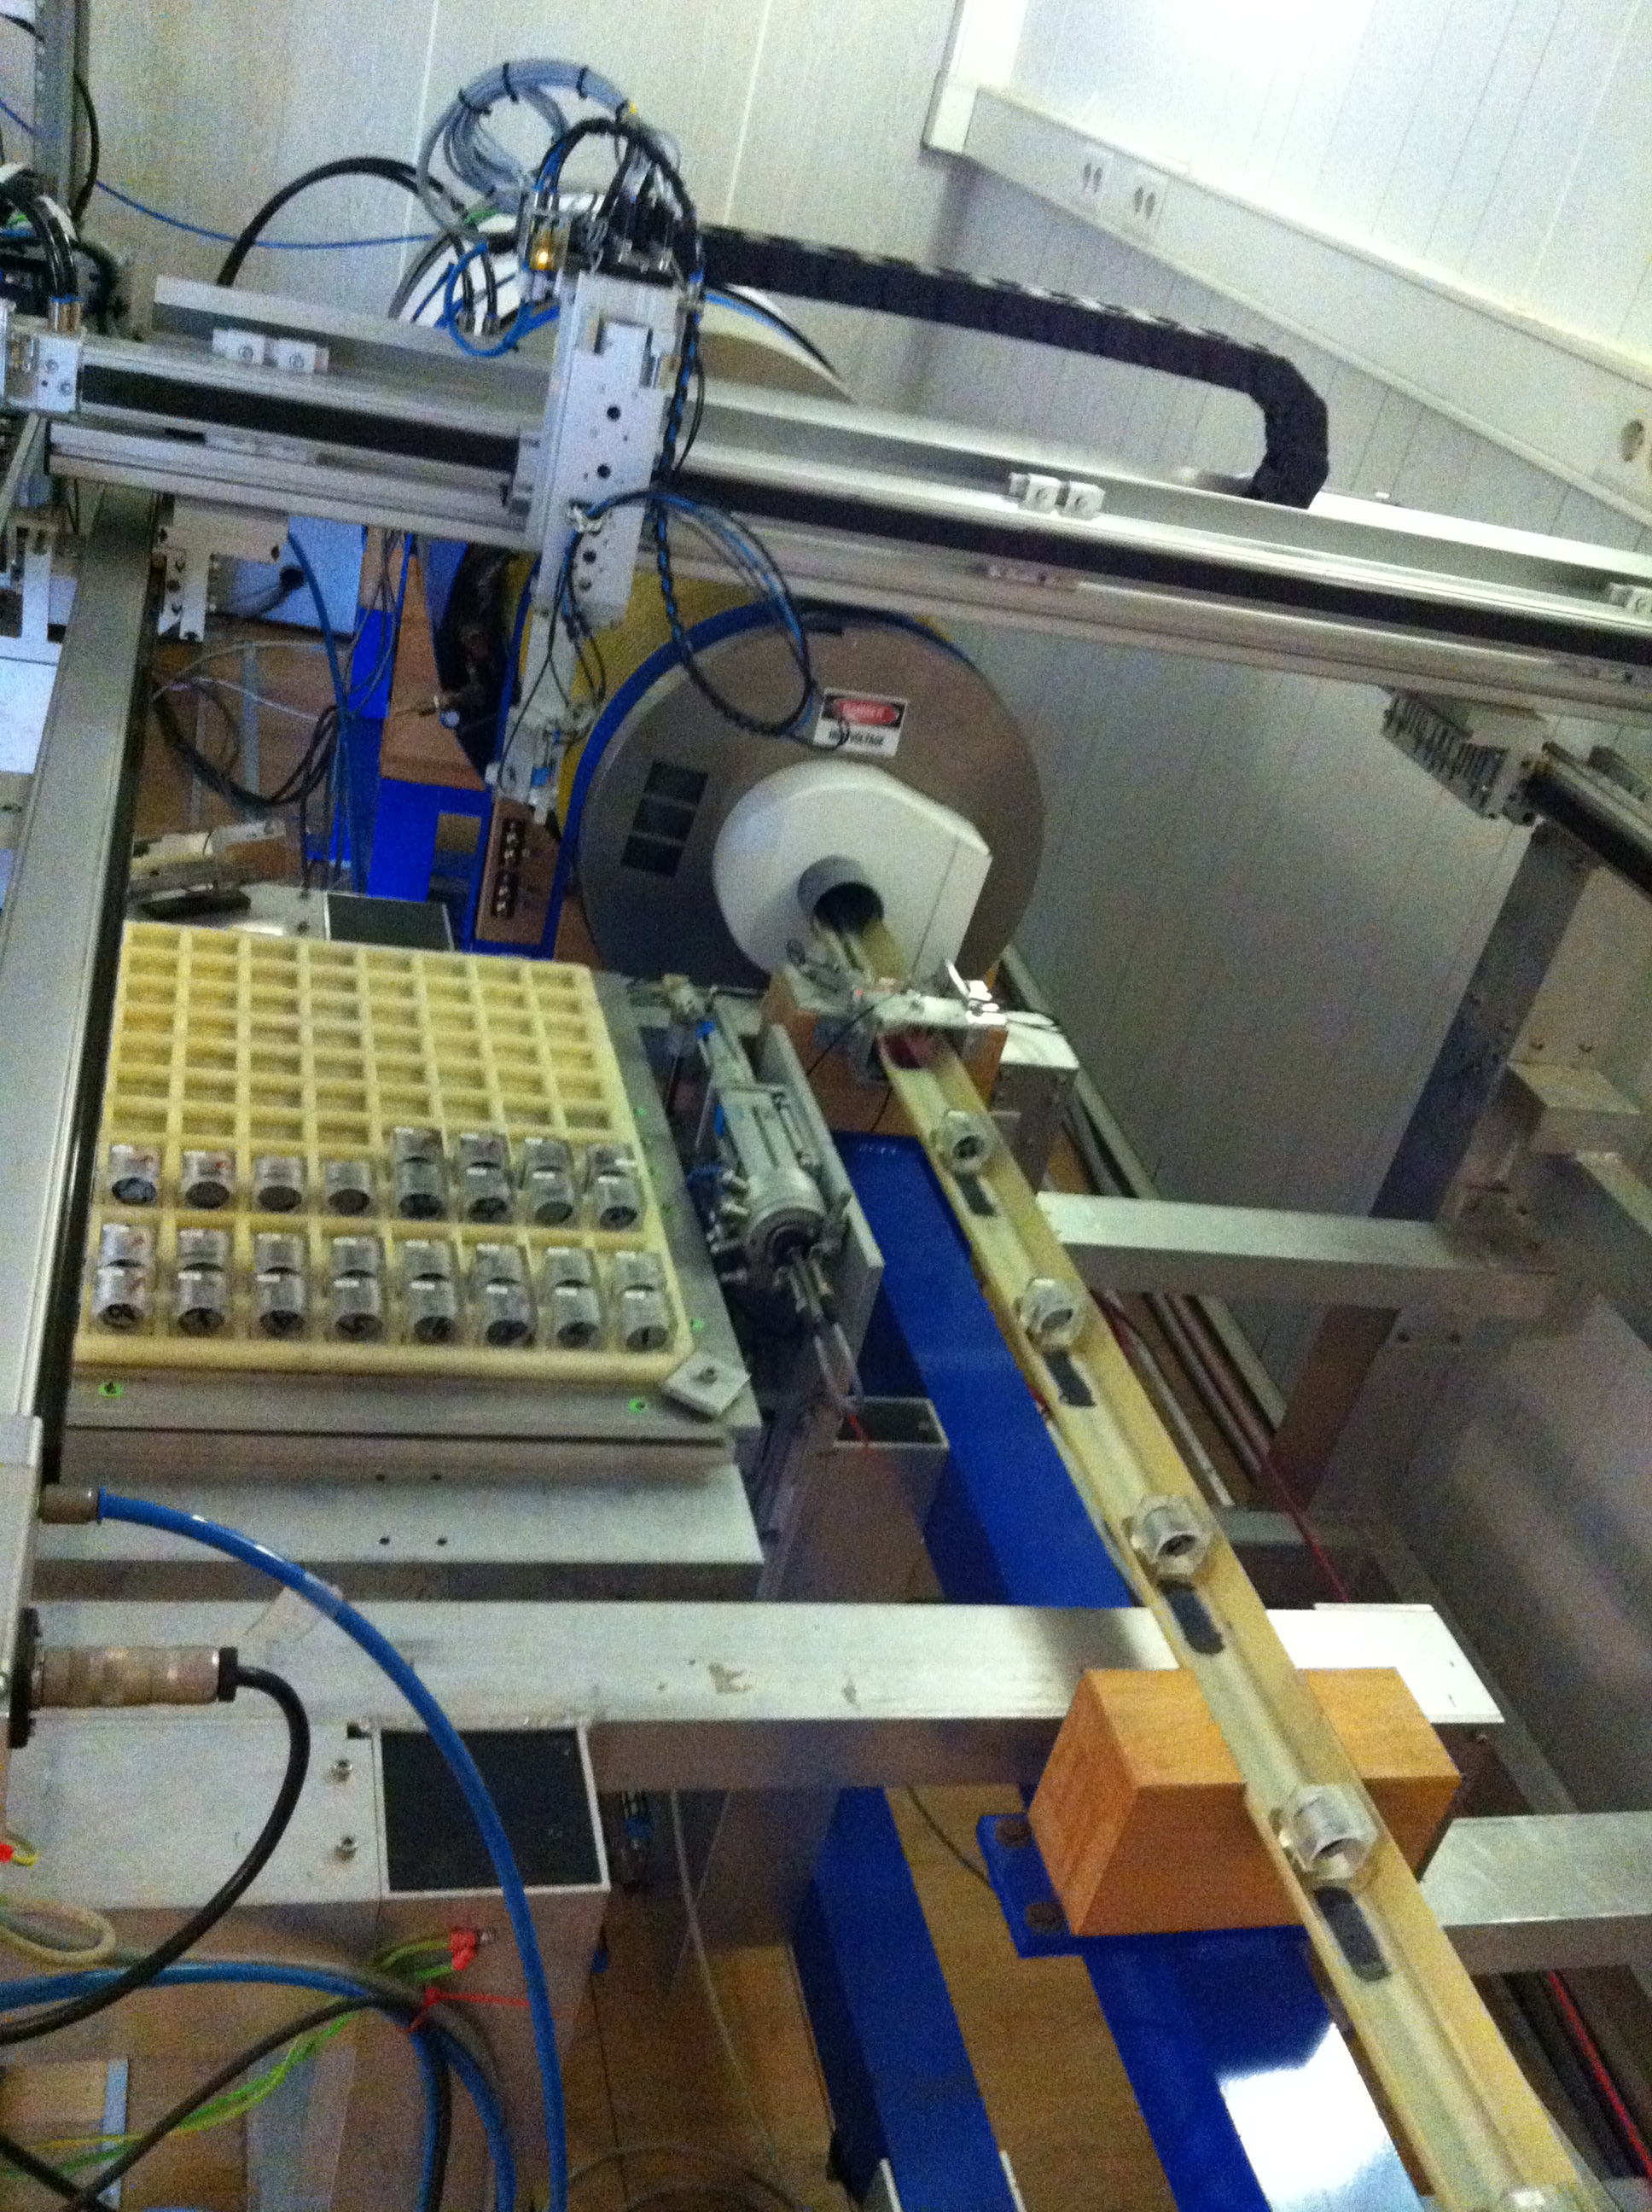
In this picture I am preparing to measure the positive y component of the magnetic vector in the samples as part of the anisotropy experiment.
In the next four weeks, I intend to carry out at least two more palaeointensity experiments and look at tiles which lined the drains from the baths. If all goes well, I should have time at the end to discuss my results with Philippe and others at Rennes 1.
Its really good to visit another lab and carry out experiments because invariably they have different instruments to those at Liverpool, different techniques are favoured and its always good to have fresh ears to discuss your work with! I am finding it a very rewarding experience and sometimes I even think my French might be improving!
")